Fun With Caches
A recent thread about latency numbers on Hacker News reminded me that I had meant to write a few blog posts about caches that I never did get around to. So I took a trip down to the cellar (what I call my “Drafts” folder), sniffed this post and decided it’s ready.
I first saw the technique used for generating these latency numbers in exercise 5.2 on page 476 of Computer Architecture: A Quantitative Approach[1] by Hennessy and Patterson.
The basic idea is that you write a program to walk a contiguous region of memory using different strides and time how long accessing the memory takes. The idea for this exercise comes from the Ph.D. dissertation of Rafael Héctor Saavedra‑Barrera, where he describes the following approach:
Assume that a machine has a cache capable of holding \(D\) 4‑byte words, a line size of \(b\) words, and an associativity \(a\). The number of sets in the cache is given by \(D/ab\). We also assume that the replacement algorithm is LRU, and that the lowest available address bits are used to select the cache set.
Each of our experiments consists of computing many times a simple floating-point function on a subset of elements taken from a one-dimensional array of \(N\) 4-byte elements. This subset is given by the following sequence:
\[1, s+1, 2s+1, ..., N-s+1\]Thus, each experiment is characterized by a particular value of \(N\) and \(s\). The stride s allows us to change the rate at which misses are generated, by controlling the number of consecutive accesses to the same cache line, cache set, etc. The magnitude of \(s\) varies from \(1\) to \(N/2\) in powers of two.
He goes on to note
Depending on the magnitudes of \(N\) and \(s\) in a particular experiment, with respect to the size of the cache (\(D\)), the line size (\(b\)), and the associativity (\(a\)), there are four possible regimes of operations; each of these is characterized by the rate at which misses occur in the cache. A summary of the characteristics of the four regimes is given in table 5.1.
And table 5.1 helpfully summarizes the regimes.
| Size of Array | Stride | Frequency of Misses | Time per Iteration |
|---|---|---|---|
\(1\leq N\leq D\) |
\(1\leq s \leq N/2\) |
no misses |
\(T\) |
\(D < N\) |
\(1\leq s\leq b\) |
one miss every \(b/s\) elements |
\(T\) |
\(D < N\) |
\(b\leq s < N/a\) |
one miss every element |
\(T + M\) |
\(D < N\) |
\(N/a\leq s\leq N/2\) |
no misses |
\(T\) |
I thought it would be fun to try it, so I wrote a program to do that. If you want to download it, go to github, but the guts of it is this function:
void
sequential_access(u32 cache_max)
{
  u32 i, stride;
  u32 steps, csize, limit;
  double	sec0, sec;
  u32 **start;
  register u32 **p;

  for (csize=CACHE_MIN; csize <= cache_max; csize*=2) {
    for (stride=1; stride <= csize/2; stride=stride*2) {
      sec = 0.0;
      limit = csize - stride + 1;
      steps = 0;
      start = linear(buffer, stride, limit);
      do {
	sec0 = timestamp();
	for (i=SAMPLE*stride; i > 0; i--)
	  for (p = start; p; p = (u32 **)*p) ;
	steps++;
	sec += timestamp() - sec0;
      } while (sec < 1.0);

      printf("%lu\t%lu\t%.1lf\n",
	     stride * sizeof(u32*),
	     csize * sizeof(u32*),
	     sec*1e9/(steps*SAMPLE*stride*((limit-1)/stride+1)));
      fflush(stdout);
    }
    printf("\n\n");
    fflush(stdout);
  }
}
As you can see, it’s a very simple program that times a loop accessing a cache in different strides. Just like the exercise in Hennessy and Patterson and just like the description in Saavedra-Barrera’s dissertation.
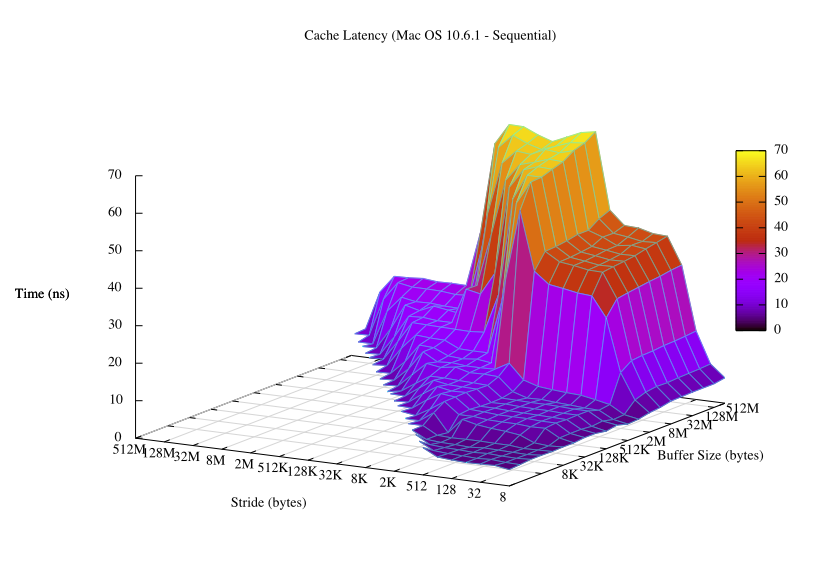
I ran this program on my machine after rebooting in single-user mode like Hennessy and Patterson suggest so that virtual addresses track physical addresses a little closer, and with a little help from gnuplot, I got this:

You can tell a lot by just glancing at that graph. You can see what the cacheline size is, what the sizes of the L1 and L2 caches are, what the page size is, the associativity of the cache, the TLB size. Here is the data used to create that graph and here is the script.
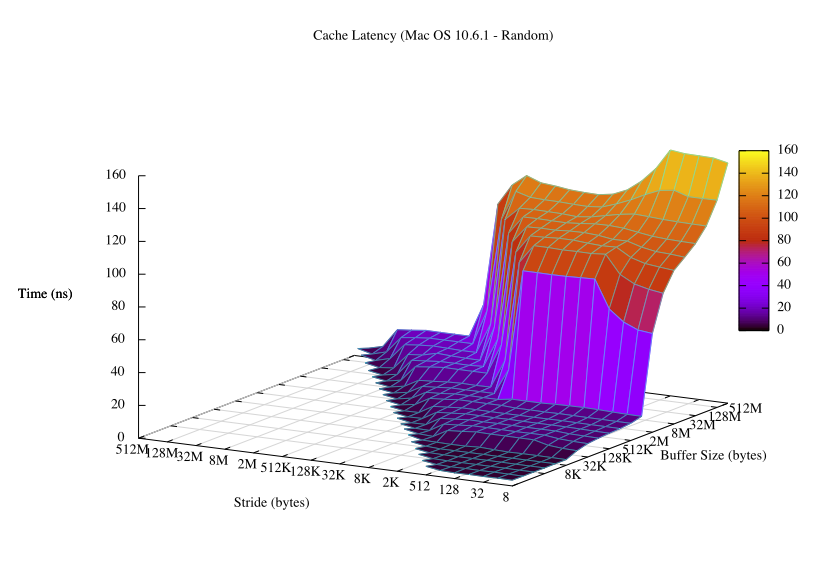
One interesting tidbit is that modern processor architectures cache aggressively, so you need to randomize the accesses to memory to get accurate timings.

 Oscar Bonilla